How to Make Editable Classroom Infographics With GPT Image
Learn an image-first workflow for creating classroom infographics with GPT Image while keeping facts, labels, and layout easy to correct. The tutorial shows how to separate visual generation from verified text, build a reusable prompt, troubleshoot common failures, and export accessible lesson visuals.
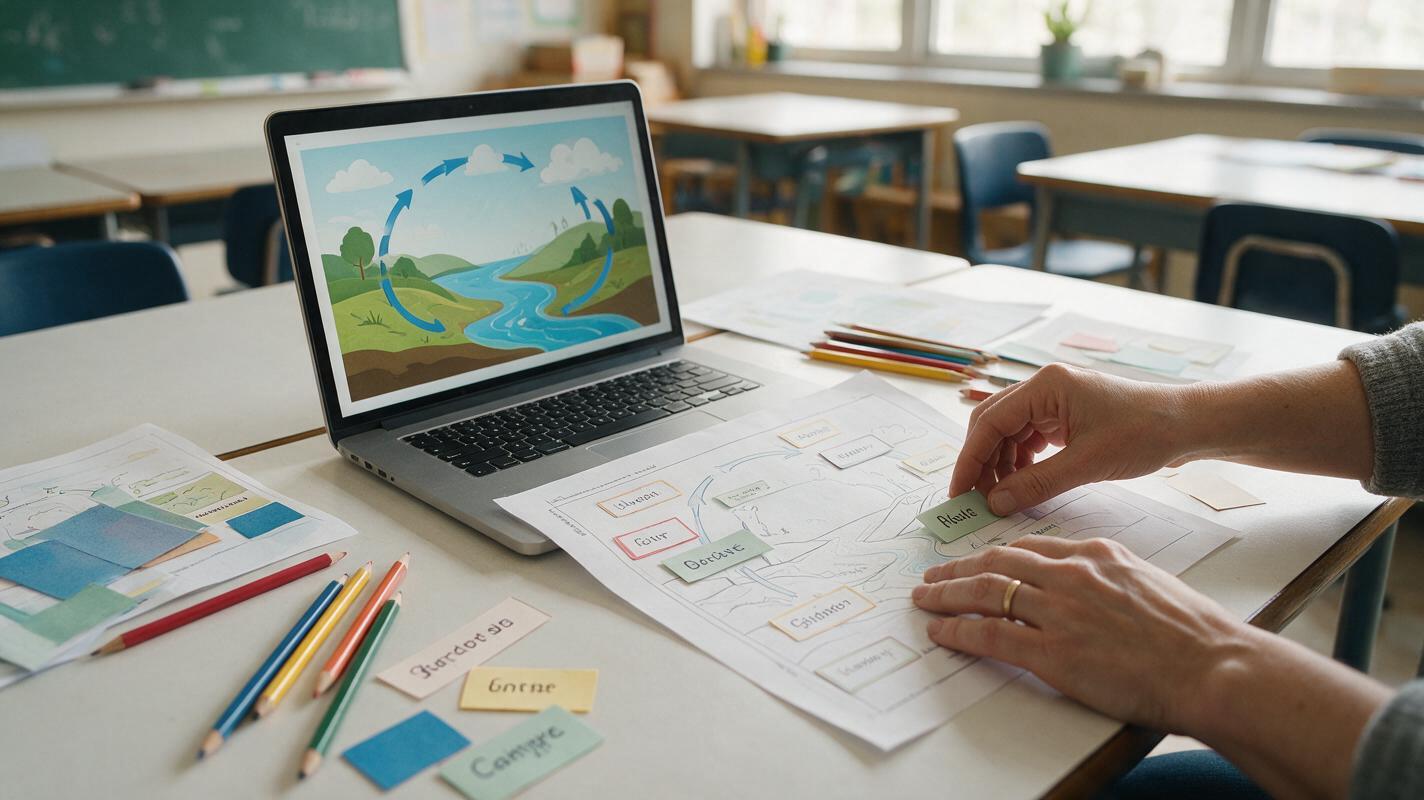
Table of contents
Create polished lesson visuals without locking mistakes into the image
Need a classroom infographic that looks engaging but remains easy to correct? Use GPT Image to create the visual system—composition, objects, color blocks, and hierarchy—then add verified labels in an editable slide or design tool. This hybrid method avoids the most common failure of generated infographics: attractive artwork containing misspelled, duplicated, or scientifically inaccurate text.
The process works for timelines, process diagrams, vocabulary sheets, safety posters, comparison charts, and course handouts. It also gives teachers and training teams a master template they can update without generating the entire visual again.
Core rule: generate the picture; typeset the facts.
Step 1 — Define one learning job for the infographic
An infographic becomes difficult to scan when it tries to teach an entire lesson. Start with one observable learning job, such as sequencing four stages, comparing two systems, identifying five parts, or following a safety procedure.
Write a compact content specification before opening an AI image generator:
Audience: Grade 6 science students
Learning job: Sequence the four stages of the water cycle
Required concepts: evaporation, condensation, precipitation, collection
Reading direction: clockwise
Final format: 16:9 classroom slide
Text policy: labels added later outside the generated image
Accuracy constraint: water changes location or state; it is not created or destroyed
Keep the number of primary ideas low enough to understand at a glance. If the topic requires dense definitions, examples, and exceptions, split it into a short series rather than shrinking everything onto one canvas.
Choose a structure that matches the concept
| Learning job | Useful structure | Typical example |
|---|---|---|
| Show sequence | Linear or circular flow | Life cycle, procedure, historical process |
| Compare ideas | Two aligned columns | Mitosis versus meiosis |
| Identify parts | Central object with callout zones | Plant cell, machine component |
| Group examples | Card grid | Vocabulary, animal classes |
| Show hierarchy | Tiered tree | Taxonomy, organization structure |
Step 2 — Build a text-safe visual brief
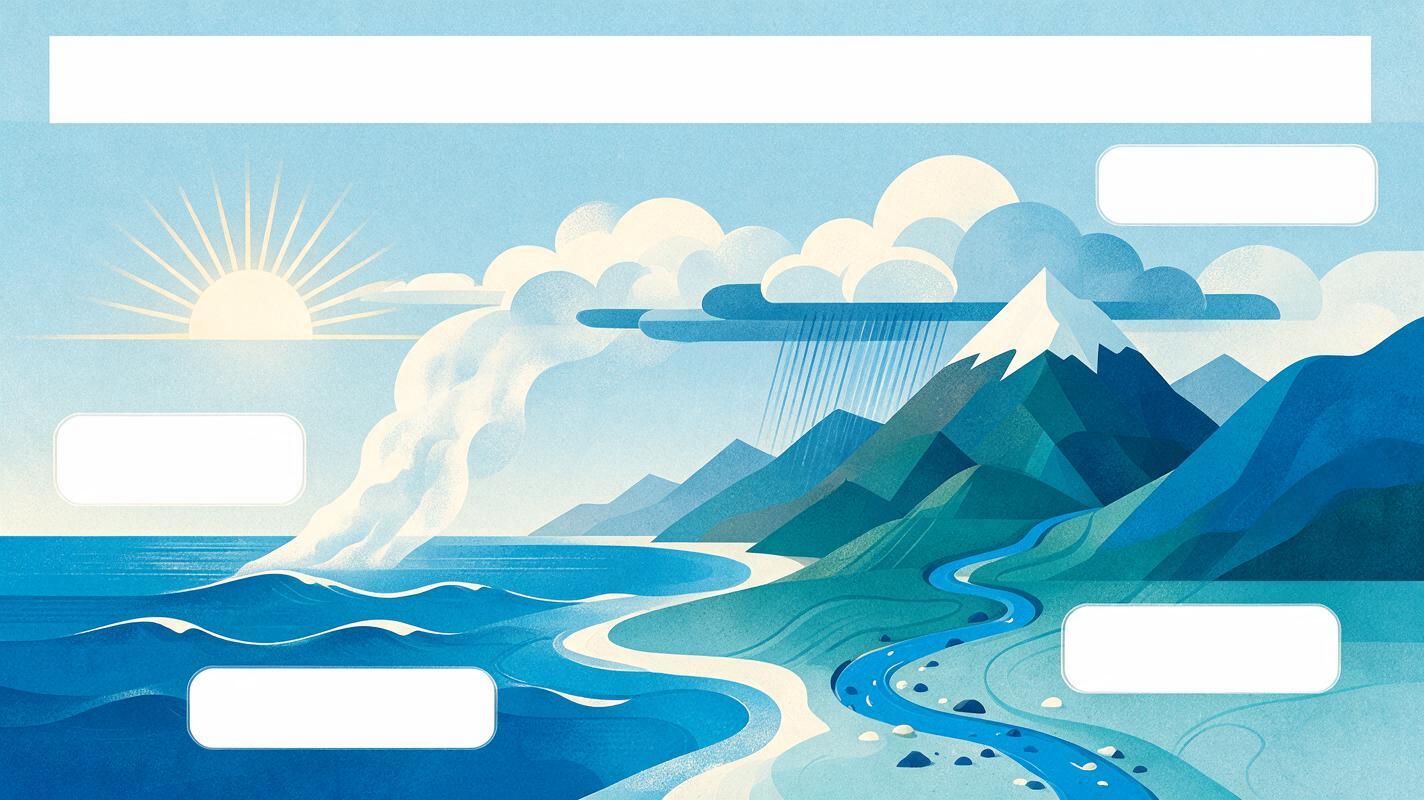
Ask for a clean illustration with intentional blank areas instead of requesting a finished poster full of words. This turns text to image generation into a layout and artwork task, where it is most useful, while your editor handles exact spelling and typography.
A reliable brief specifies five things:
- Canvas: aspect ratio and intended use.
- Structure: number and position of panels, steps, or callouts.
- Visual language: flat vector, cut-paper, textbook diagram, or realistic objects.
- Reserved text zones: blank title bar, label boxes, caption strip, or margin.
- Exclusions: no words, letters, numbers, logos, watermark, decorative pseudo-text, or extra objects.
For a water-cycle lesson visual, use:
Create a clean 16:9 educational infographic background for middle-school science.
Show one coherent landscape with ocean, sun, rising water vapor, clouds, rain,
and runoff returning to the ocean. Arrange the motion as a clear clockwise cycle.
Include four large empty rounded label boxes near the relevant stages and an empty
title band at the top. Flat textbook illustration, restrained blue and teal palette,
high contrast, generous whitespace, simple shapes, classroom-appropriate.
No text, no letters, no numbers, no symbols resembling text, no watermark,
no extra process stages.
Requesting “empty rounded label boxes” is usually more dependable than asking the model to render precise terminology. If a blank box still contains stray marks, remove them with a targeted edit or cover the box in your slide editor.
Step 3 — Generate a small set of layout candidates
Create three or four candidates from the same brief. Evaluate structure before artistic detail. A beautiful image is not useful if students cannot tell where to look first.
Score each candidate against these questions:
- Is the reading path obvious without an explanation?
- Does every visual element represent a required concept?
- Are the blank label zones large enough for real text?
- Is there enough contrast behind each future label?
- Can the image be cropped for a slide or worksheet?
- Are relationships and directions conceptually accurate?
Do not select a candidate because it has the most detail. Select the one that makes the intended relationship clearest.
When a composition is close, revise only the weak point:
Keep the same landscape, clockwise arrangement, palette, and four empty label boxes.
Move the cloud cluster slightly right so it does not overlap the top title band.
Make the runoff path visibly connect the mountain to the ocean.
Remove all stray glyphs and preserve a clean 16:9 frame.
Test this prompt yourself, then compare the outputs at the size students will actually see—not only while zoomed in.
Step 4 — Add verified labels in an editable layer
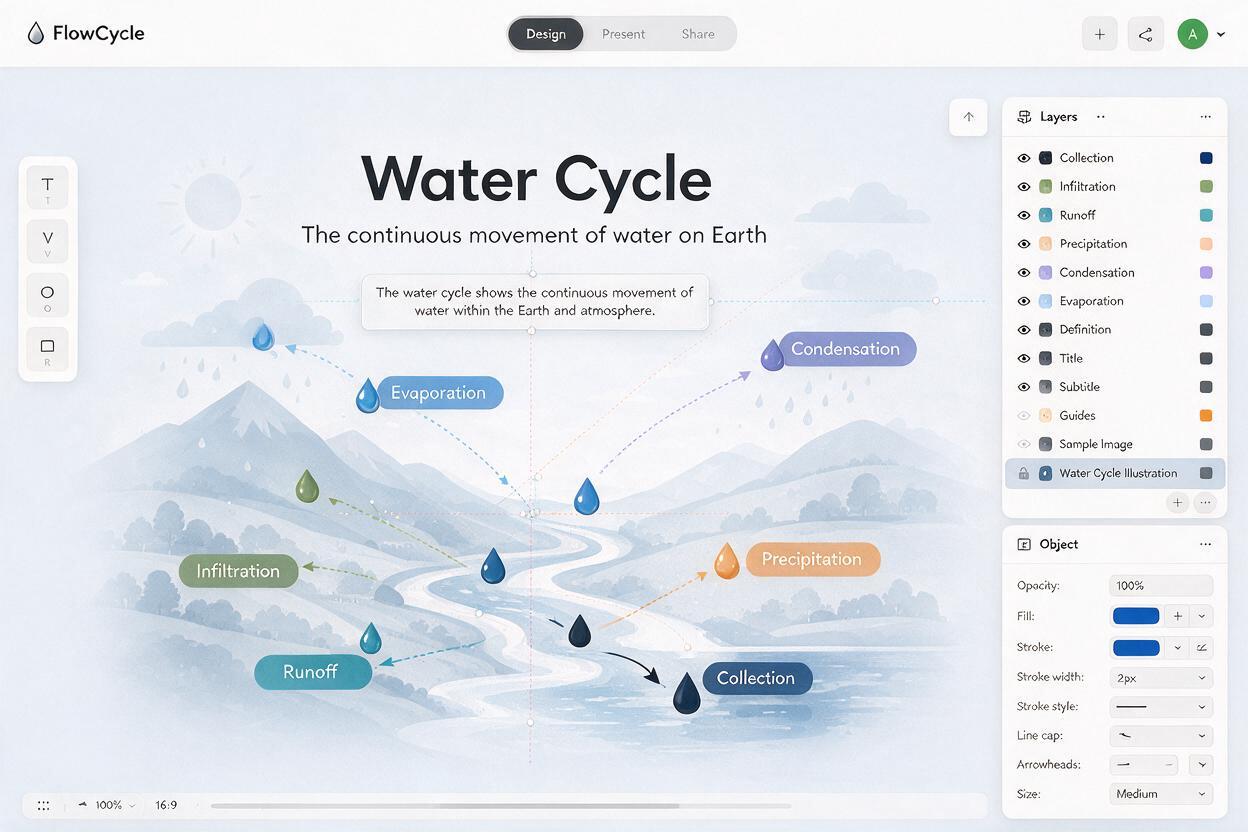
Import the chosen background into presentation, document, or design software. Lock it as the bottom layer. Add the title, labels, arrows, definitions, and source note as native editable elements above it.
For the example, the overlay could contain:
Title: The Water Cycle
1. Evaporation — Liquid water gains energy and becomes water vapor.
2. Condensation — Water vapor cools and forms tiny liquid droplets.
3. Precipitation — Water falls from clouds as rain, snow, sleet, or hail.
4. Collection — Water gathers in oceans, lakes, soil, and groundwater.
Keep language parallel: each definition begins with the process subject and uses one concise sentence. Check every statement against your curriculum or an authoritative subject source before distribution.
Make the typography classroom-readable
- Use one typeface family and no more than three text sizes.
- Keep body labels horizontal rather than angled along arrows.
- Use strong color contrast and avoid placing text over busy artwork.
- Align labels to a grid so equal concepts look equally important.
- Do not communicate meaning through color alone; pair colors with labels or shapes.
- Leave enough margin for projector cropping and printed page edges.
Step 5 — Check accuracy, accessibility, and projection
Review the infographic in three passes. Separating the passes helps you catch errors that are easy to miss while focusing on appearance.
Pass A: subject accuracy
- Confirm names, quantities, arrows, sequence, scale, and causal relationships.
- Remove decorative details that could imply a false process.
- Check whether simplification changes the meaning.
Pass B: visual comprehension
- View the slide at normal presentation size.
- Temporarily blur or squint at it: the main hierarchy should remain visible.
- Ask a colleague to identify the reading order without instructions.
Pass C: accessibility
- Provide alt text describing the instructional meaning, not every decorative detail.
- Ensure labels remain readable with color-vision differences.
- Include a text equivalent in lesson notes or the learning platform.
- Avoid embedding essential instructions only inside the image.
An effective alt-text draft for this example is:
Clockwise diagram of the water cycle: sunlight drives evaporation from the ocean;
water vapor condenses into clouds; precipitation falls over land; runoff and
collection return water to the ocean.
Step 6 — Troubleshoot common infographic failures
| Problem | Likely cause | Practical fix |
|---|---|---|
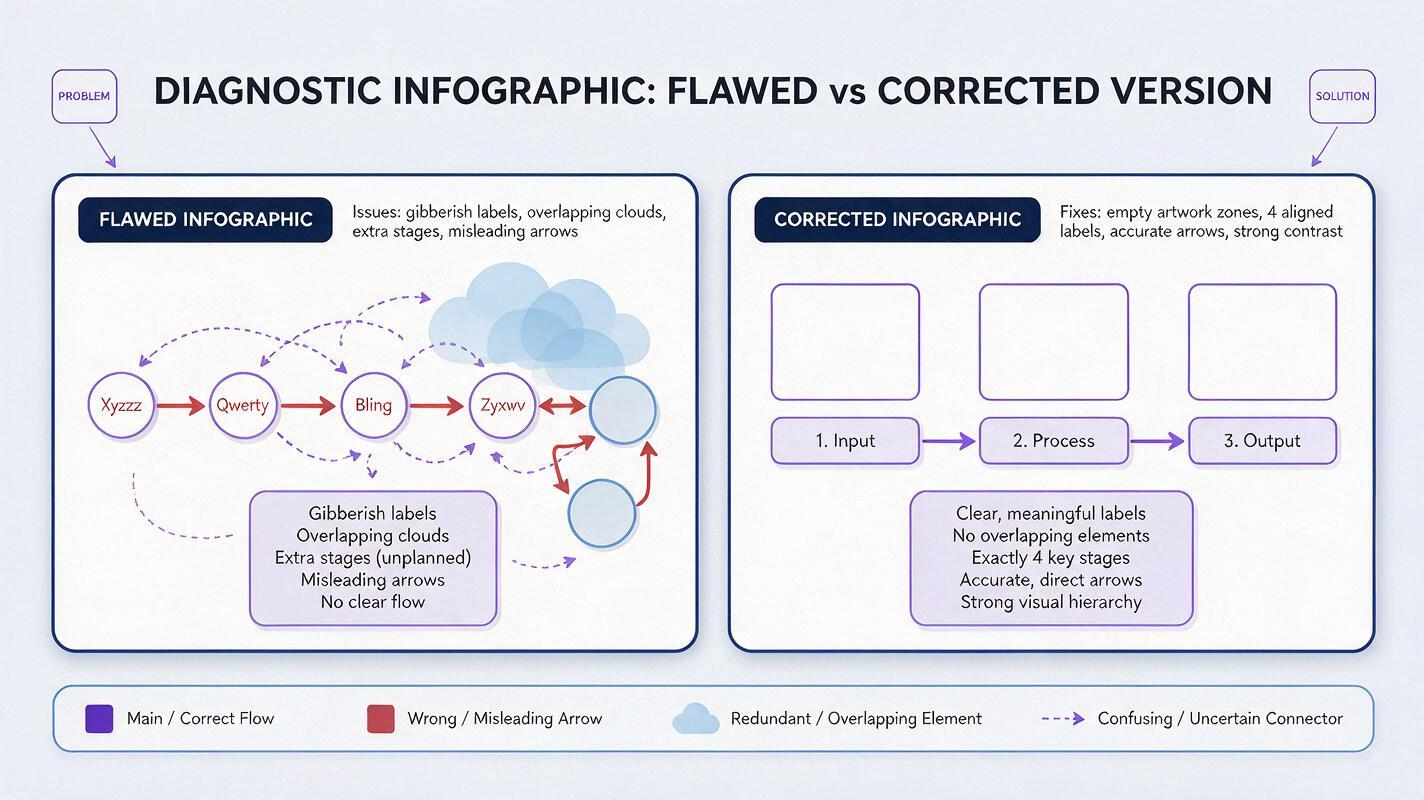
| Gibberish appears in blank boxes | The prompt implies a finished poster | Repeat “no text or glyphs,” request plain empty shapes, or clean the area with editing. |
| The layout has extra stages | The concept count is not constrained | State the exact number of panels and list only the required objects. |
| Arrows imply the wrong relationship | The model prioritizes composition over logic | Generate without arrows and add accurate vector arrows manually. |
| Labels do not fit | Placeholder zones were underspecified | Provide approximate box positions and ask for generous whitespace. |
| The image looks too childish or too corporate | The audience and visual language are vague | Name the learner level and specify “textbook illustration,” “technical training diagram,” or another precise style. |
| Small details vanish on a projector | The design was judged only on a monitor | Simplify the background, enlarge key objects, and test from the back of the room. |
If a generated arrow, measurement, anatomy feature, or safety symbol could affect understanding, replace it with a manually controlled element. Accuracy should never depend on an attractive approximation.
Step 7 — Export an editable master and reusable variants
Save a master file that preserves the background and all text layers. Then export the formats required by the lesson:
- Presentation version: large labels and minimal supporting text.
- Printable version: adequate margins and tested grayscale contrast.
- Learning-platform version: compressed image plus nearby text equivalent.
- Student activity version: remove selected labels and provide a word bank.
- Translated version: duplicate the editable text layer rather than regenerating the artwork.
This is where the hybrid approach pays off. A spelling correction, localization request, or curriculum update takes minutes because the facts were never flattened into the generated background. Save the original brief with the master so another instructor can create a matching visual later.
Final checklist
- The infographic teaches one clearly defined learning job.
- The visual structure matches the relationship being explained.
- Generated artwork contains no essential text.
- All labels and arrows remain editable.
- Facts have been checked against an authoritative source.
- Text is readable at the real display or print size.
- Color is not the only carrier of meaning.
- Alt text or an equivalent explanation is included.
- An editable master is saved before export.
Keywords
classroom infographics, GPT Image, educational illustrations, lesson visuals, AI image generator, infographic prompts, accessible learning content