Imagen Prompts for Food Web Diagrams Without Reversed Arrows
Food web diagrams become misleading when AI reverses energy-flow arrows, invents feeding relationships, or hides essential connections. This guide shows educators how to use Imagen for consistent organism artwork while keeping ecological evidence, arrows, labels, and assessment decisions under human control.
Table of contents
Create the artwork without surrendering the science
A polished food web is still wrong if one arrow sends energy from a fox to the rabbit it eats. Imagen can help produce coherent organism illustrations for worksheets, slides, and explainers, but a single prompt should not be trusted to decide every ecological relationship. The reliable method is to separate visual generation from scientific mapping: verify the organisms and feeding links first, generate the artwork second, and add arrows and labels in an editable layout.
This approach is useful for elementary food chains, secondary ecosystem webs, ecological review activities, and training materials in which learners must interpret energy transfer accurately.
Why complete AI-generated food webs often fail
A food web combines several tasks that look simple but require different kinds of control. The image needs recognizable organisms, readable labels, an orderly composition, and arrows that encode a precise scientific relationship. Asking an image model to solve all of these simultaneously increases the chance of subtle errors.
- Arrow direction becomes ambiguous. Everyday language focuses on which animal eats another, while science diagrams usually show energy moving from the food source to the consumer.
- Relationships may be invented. A plausible-looking predator-prey link may not belong in the ecosystem, region, season, or evidence set being taught.
- Labels can drift. Text may be misspelled, attached to the wrong organism, or rendered too small for a projected lesson.
- Complex webs become tangled. Crossing lines can make a correct relationship difficult to follow.
- Visual style can override instructional value. Dramatic scenes may introduce irrelevant behavior, habitat details, or size relationships.
Use Imagen to create the visual vocabulary of the diagram. Use verified source material and editable graphics to create its scientific logic.
Separate ecological evidence from visual generation
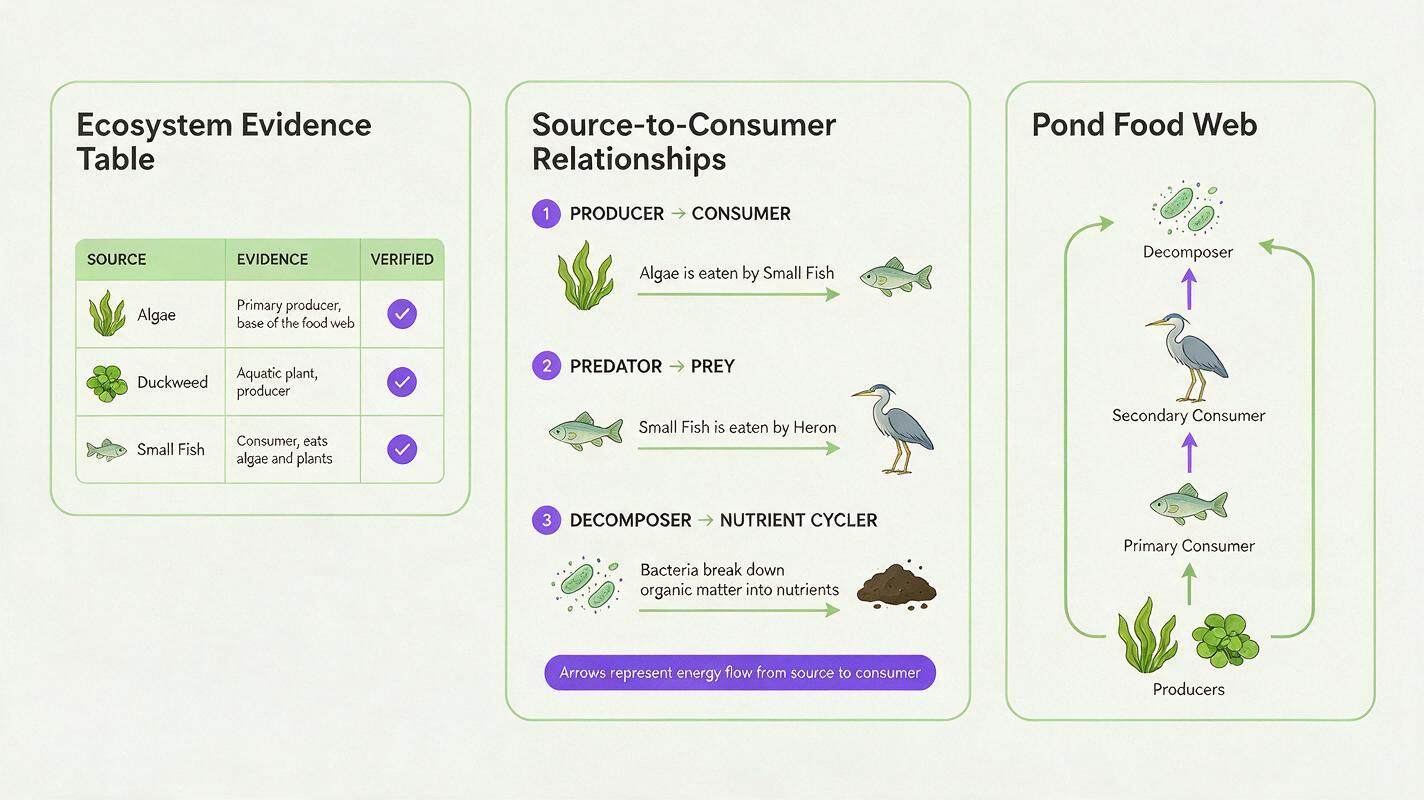
Start with a relationship list rather than an art prompt. Consult the textbook, curriculum source, field guide, or subject specialist used for the lesson. Record each organism, its role, and only the feeding relationships supported by that source.
Write every relationship in the direction that the final arrow must travel:
food or energy source -> consumer

grass -> grasshopper
grasshopper -> frog
frog -> snake
snake -> hawk
This notation removes the ambiguity of phrases such as “the frog eats the grasshopper.” It also makes the diagram easier to audit later.
| Evidence field | Example | Why it matters |
|---|---|---|
| Ecosystem | Temperate pond edge | Prevents unrelated species from being mixed |
| Organism | Green frog | Defines the visual asset required |
| Role | Secondary consumer | Supports lesson-level classification |
| Receives energy from | Grasshopper | Determines the incoming arrow |
| Transfers energy to | Water snake | Determines the outgoing arrow |
| Source status | Verified or uncertain | Keeps assumptions out of assessed material |
If a relationship changes by region, season, or life stage, either verify the exact context or leave it out. More arrows do not automatically make a better teaching diagram.
Generate organism assets before drawing relationships
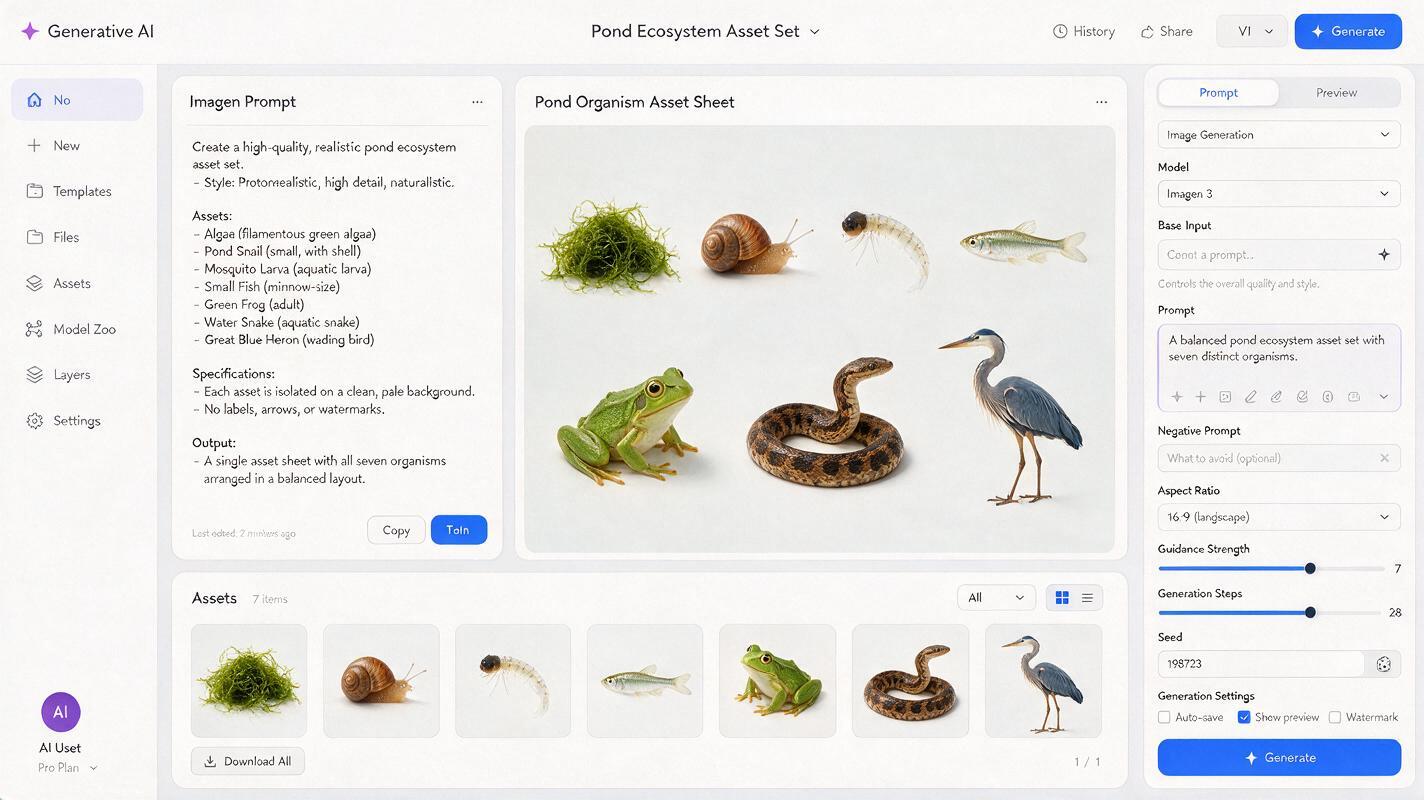
Open MagicBoat’s ai image generator and select Imagen. Generate an organism asset sheet with no arrows, labels, decorative borders, or background narrative. This gives the model one visual job and leaves the semantic structure editable.
Use a prompt such as:
Educational organism asset sheet for a temperate pond food web.
Include exactly: algae, pond snail, mosquito larva, small fish,
green frog, water snake, great blue heron.

Show each organism once, fully visible, separated from the others,
in a consistent clean natural-history illustration style.
Neutral pale background, even scale treatment, clear silhouettes,
no labels, no arrows, no food web lines, no predation scene,
no additional species, no decorative elements.
The phrase “even scale treatment” does not mean the organisms are biologically the same size. It asks for similarly usable diagram assets. If relative size is part of the lesson objective, represent it separately with a verified scale guide rather than allowing the asset sheet to imply literal proportions.
Correct one organism without regenerating the set
If the frog has an unclear silhouette or the heron is cropped, request a focused replacement. Avoid regenerating the entire sheet, because unrelated organisms may change.
Replace only the green frog asset.
Keep the same illustration style, viewing angle, background,
line quality, and color treatment as the reference sheet.
Show one complete green frog in a neutral resting pose.
Do not change or add any other organism.
No text, arrows, habitat scene, or border.
Before moving on, count the organisms, check that each requested species appears once, and reject any image containing extra predators or prey.
Build the diagram in an editable canvas
Place the approved assets in presentation, diagramming, or page-layout software. Arrange producers near the base or left side, intermediate consumers through the center, and higher-level consumers toward the top or right. This convention is optional, but a consistent flow reduces unnecessary line crossings.
Add arrows manually from the organism being consumed toward the consumer receiving the energy. For example, the arrow for a grasshopper eaten by a frog runs from grasshopper to frog.
- Use one consistent arrowhead style.
- Keep arrowheads large enough to remain visible on a projector or printed worksheet.
- Curve only the lines that would otherwise cross or cover an organism.
- Place labels outside the illustrations rather than embedding text inside generated artwork.
- Do not rely on color alone to distinguish relationship types.
For younger learners, begin with a short chain before presenting a web. For advanced learners, use the same verified asset set to reveal additional relationships gradually rather than showing every connection at once.
Use a full-diagram prompt only as a layout draft
Imagen can also propose a composition for a complete food web, but treat the result as a visual draft rather than a finished scientific figure. Include an explicit edge list and prohibit all unlisted connections.
Create a clean classroom layout draft for a pond food web.
Use only these nodes: algae, pond snail, mosquito larva,
small fish, green frog, water snake, great blue heron.

Allowed directed connections, written as energy source -> consumer:
algae -> pond snail
algae -> mosquito larva
mosquito larva -> small fish
mosquito larva -> green frog
small fish -> water snake
small fish -> great blue heron
green frog -> water snake
water snake -> great blue heron

Do not add organisms or relationships.
Minimize crossing lines. Leave generous space for editable labels.
No title and no decorative habitat background.
Rebuild the approved composition with editable arrows afterward. Even when the draft looks correct, inspect every edge against the source list rather than judging it by visual plausibility.
Audit the finished web as an assessment artifact
A diagram used for instruction must pass both a science check and a communication check. Trace every arrow from tail to head and read it aloud as “energy moves from this organism to this consumer.” If that sentence is false or confusing, correct the arrow.
| Audit question | Failure to catch | Correction |
|---|---|---|
| Does every arrow match the evidence list? | Invented feeding relationship | Remove unsupported edges |
| Does the arrow point from food to consumer? | Reversed energy flow | Reverse the connector |
| Can every organism be identified without guessing? | Ambiguous asset | Replace that illustration |
| Are labels editable and correctly spelled? | Generated text error | Retype labels in the layout tool |
| Can learners follow lines at the intended size? | Crossings or tiny arrowheads | Reposition nodes and enlarge connectors |
| Are decomposers represented accurately? | Oversimplified single recycling arrow | Add a teacher note or separate decomposition model |
Do not include a decomposer merely to satisfy a familiar diagram template. Decomposition connects to material cycling in ways that may be oversimplified by a few food-web arrows. Match its representation to the actual learning objective.
Adapt one verified web for different learning tasks
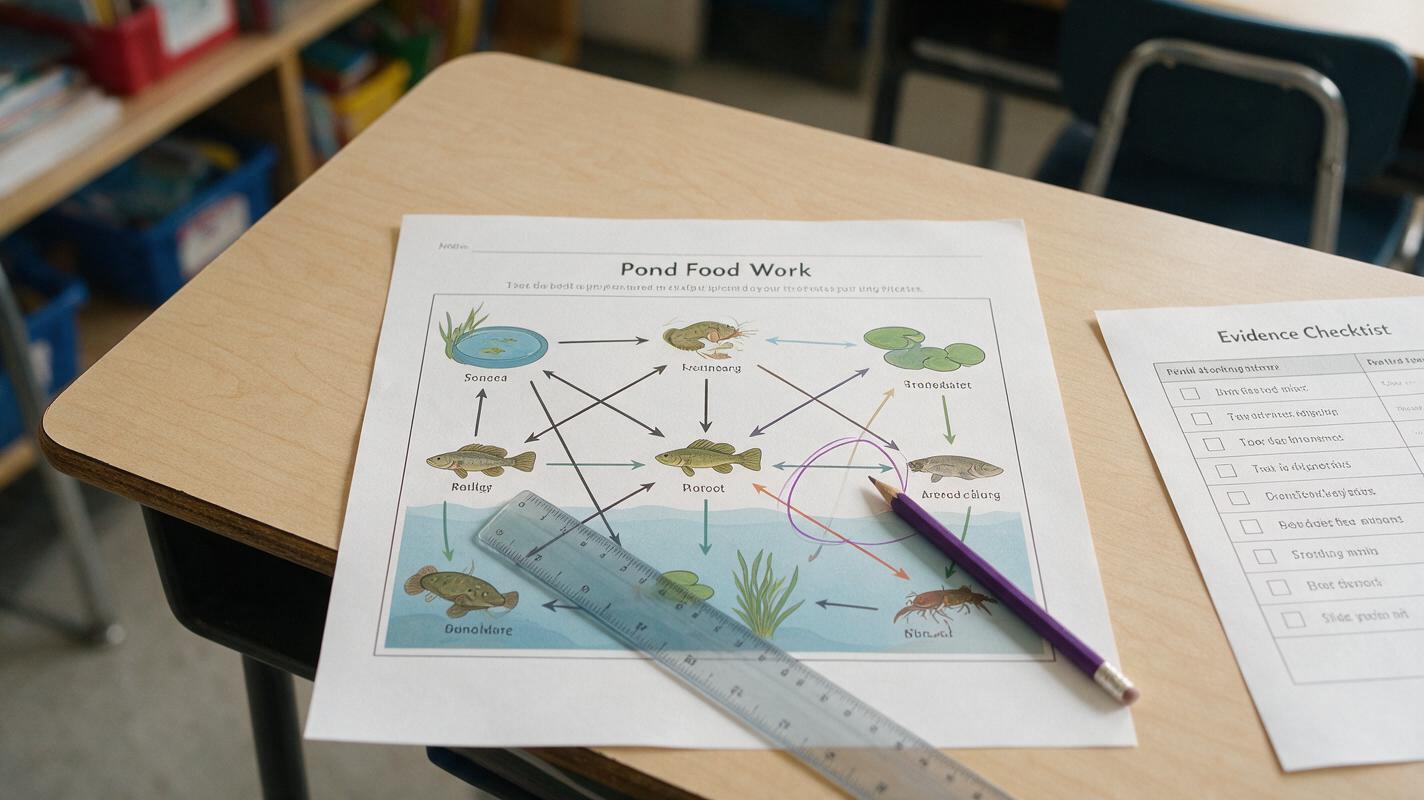
Once the underlying relationships are correct, duplicate the editable diagram instead of generating a new ecosystem for every activity.
- Introductory lesson: Show all organisms but reveal one chain at a time.
- Retrieval practice: Remove selected arrowheads and ask learners to restore the direction.
- Vocabulary task: Keep the links but replace organism labels with a word bank.
- Reasoning question: Remove one species and ask which consumers lose a direct energy source.
- Accessibility version: Use larger labels, high-contrast connectors, and a text list of all relationships.
Keep an answer version with the evidence table attached. That record makes revisions easier when a curriculum source changes or a colleague questions a connection.
Final checklist
- The ecosystem and every included relationship come from an appropriate source.
- Each arrow runs from the food or energy source to the consumer.
- Imagen generated organism artwork rather than making unreviewed scientific decisions.
- No extra species or visually plausible but unsupported links remain.
- Labels and arrows are editable outside the generated image.
- Line crossings, tiny arrowheads, and color-only distinctions have been removed.
- The final diagram has been checked at its actual projection or print size.
With the evidence list ready, test this prompt yourself and build a food web whose visual polish supports—rather than replaces—scientific accuracy.
Keywords
Imagen prompts, food web diagram, food chain arrows, science lesson visuals, ecosystem illustration, AI image generator, educational diagrams